Artisanal Fishing Behavior in Chile
Overview
This project builds a fully automated pipeline to analyze the spatial behavior of artisanal fishing vessels in southern Chile. Raw data come from SERNAPESCA’s satellite positioning system — an open daily feed of GPS positions for all registered artisanal fleets. The pipeline downloads new reports incrementally, stores them in a DuckDB database, filters the Los Lagos region, and produces fishing behavior indicators including spatial effort maps and species catch maps.
This pipeline is under active development and does not yet represent a final or fully stabilized version. The structure, outputs, and indicators may change as the project evolves.
Code and documentation available on GitHub.
Explore the fishing activity data interactively — spatial map, distance gradient from farms, and fleet trends — in the VMS Fishing Explorer.
Data source
SERNAPESCA publishes daily CSV reports with vessel ID, timestamp, latitude, longitude, and speed for every registered artisanal boat in Chile. The download script queries the public web portal incrementally, so only new reports are fetched on each run. The dataset currently covers two report formats:
| Period | Source | Frequency | Vessels included |
|---|---|---|---|
| 2019–mid 2022 | Admin snapshot reports | ~4 snapshots/day | All registered vessels (filtered to artisanal only) |
| mid 2022–2026 | Daily artisanal fleet reports | 1 report/day | Artisanal vessels only |
Pipeline structure
| Folder | Content |
|---|---|
R/ |
Download and processing scripts |
new/ |
Updated analysis scripts |
data_raw/ |
Downloaded CSVs (not versioned) |
data_processed/ |
Filtered and cleaned outputs (not versioned) |
new/outputs/ |
Figures and maps |
assets/ |
Supporting images |
To reproduce: open R and run source("R/Fisheries_Webbscrapping.R").
Selected outputs
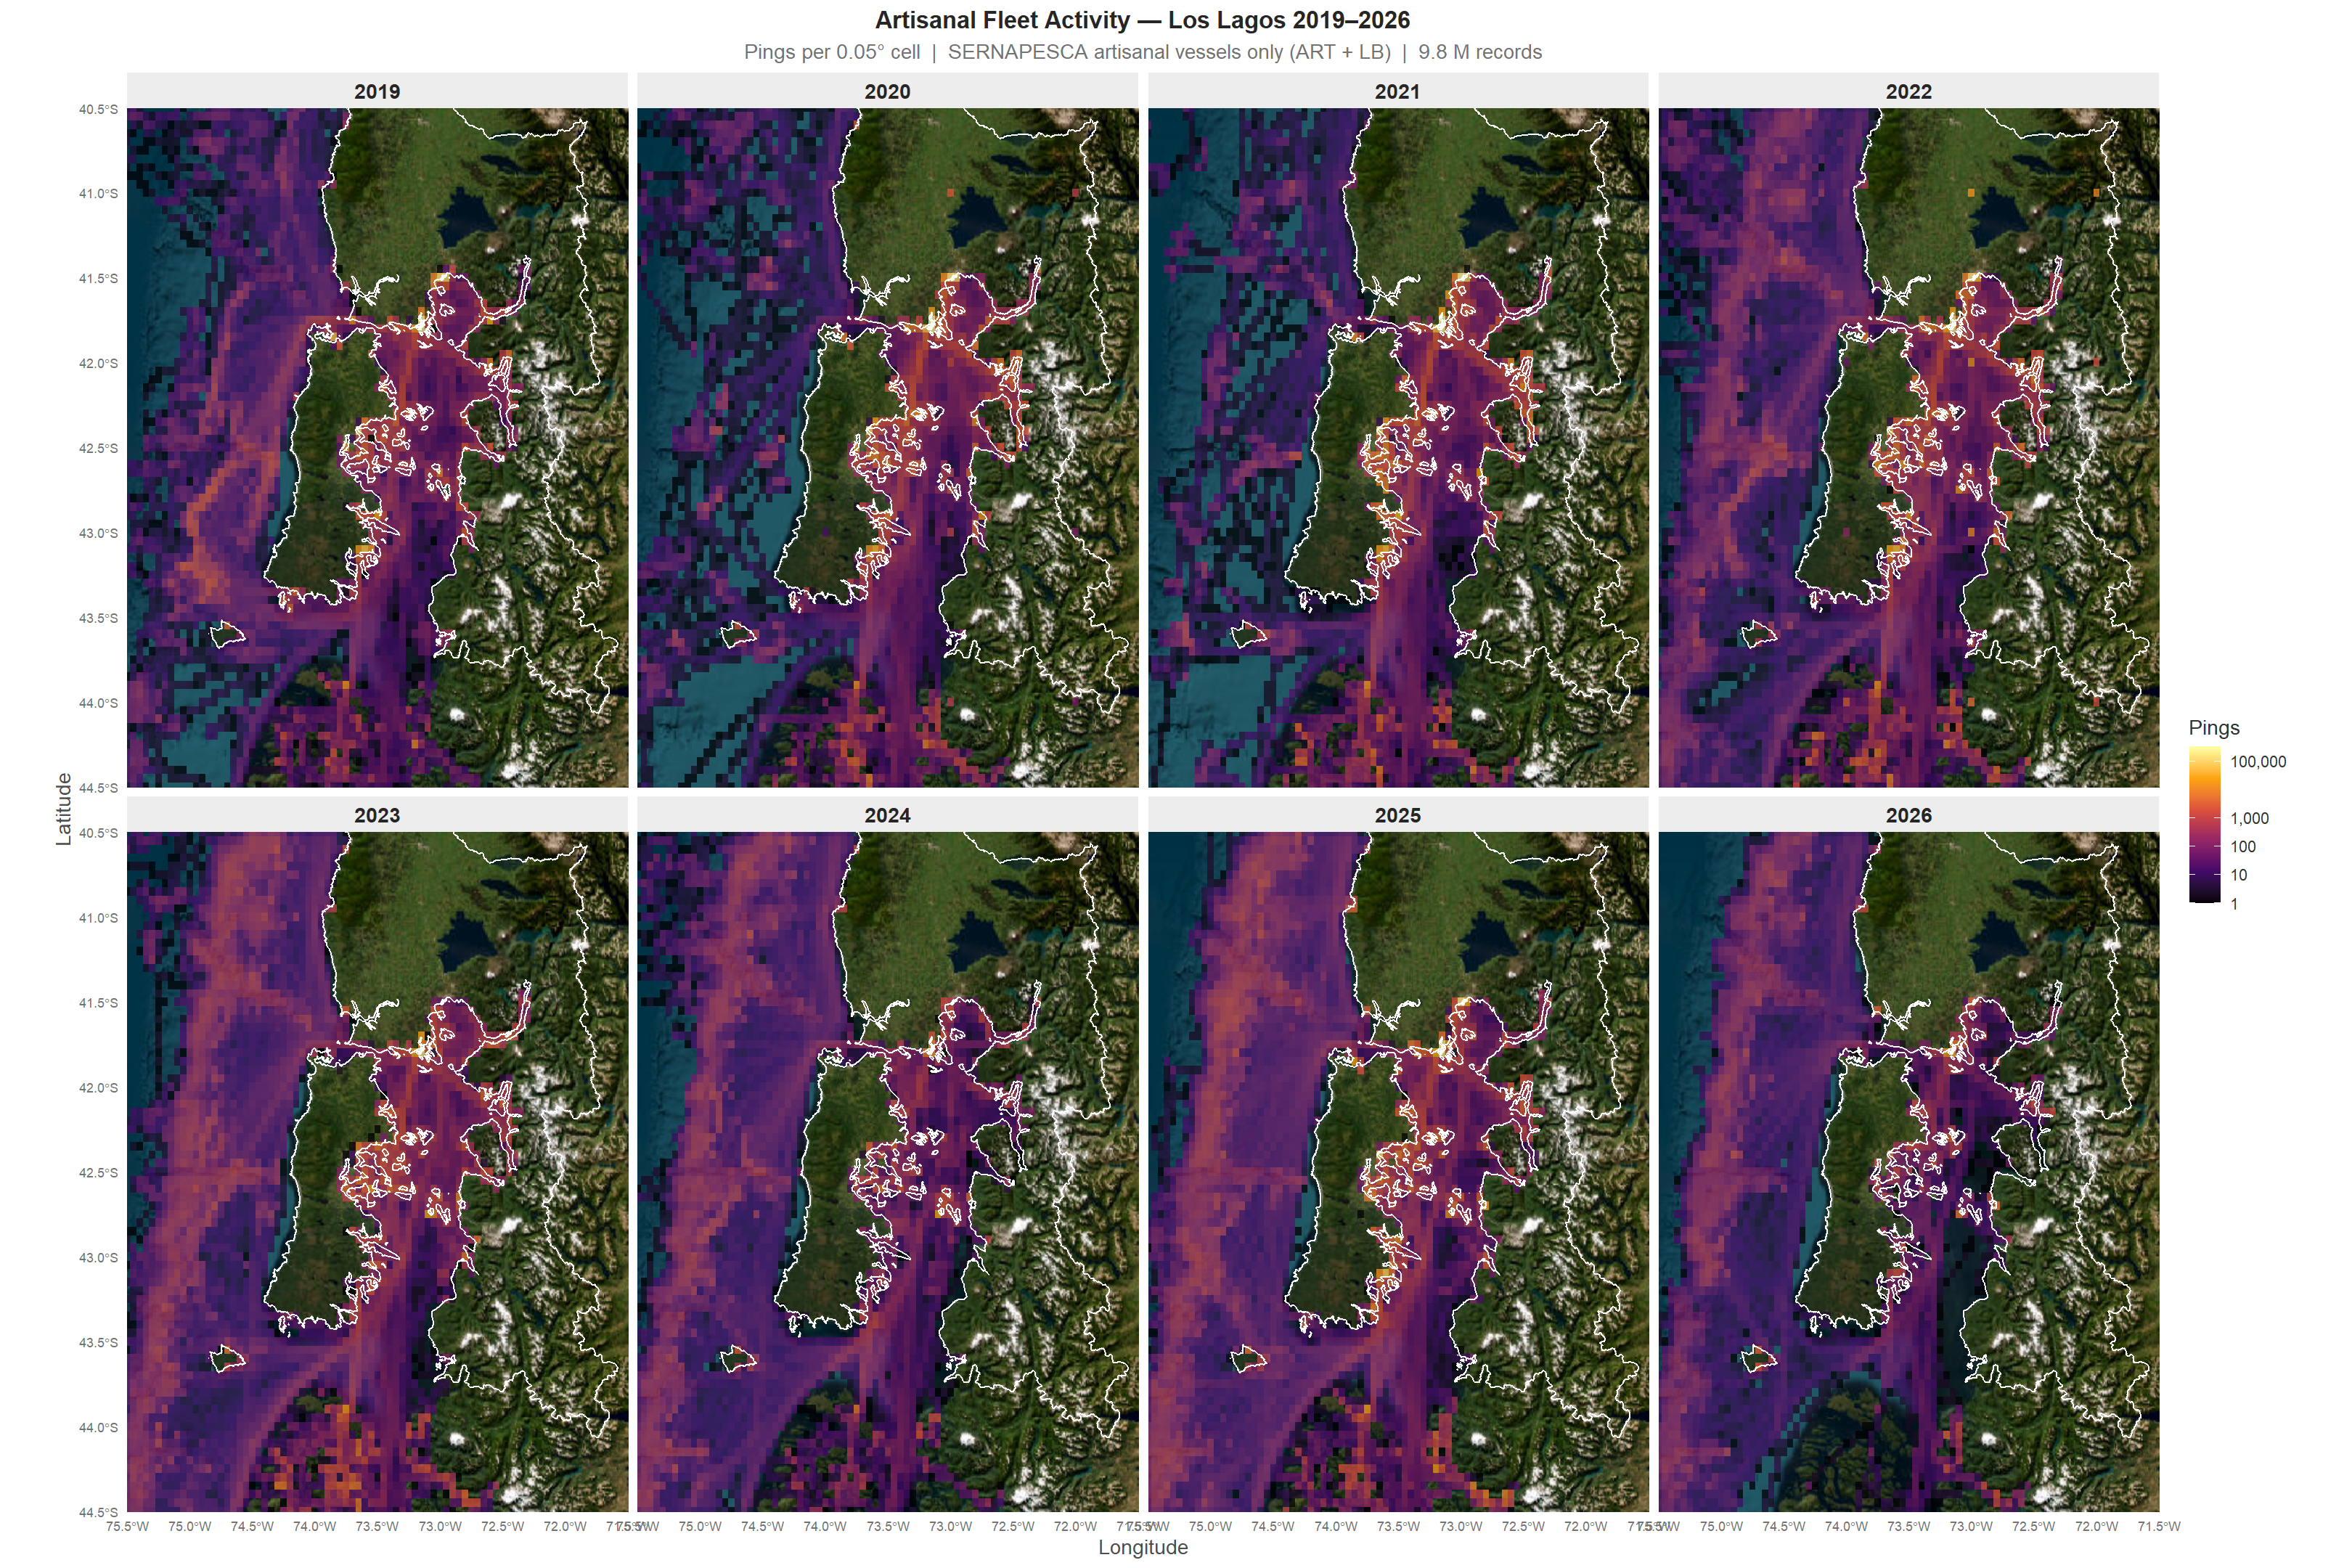
Activity heatmap
Ping density across the Los Lagos region (2019–2026), restricted to artisanal vessels ((ART) and (LB) suffixes only):
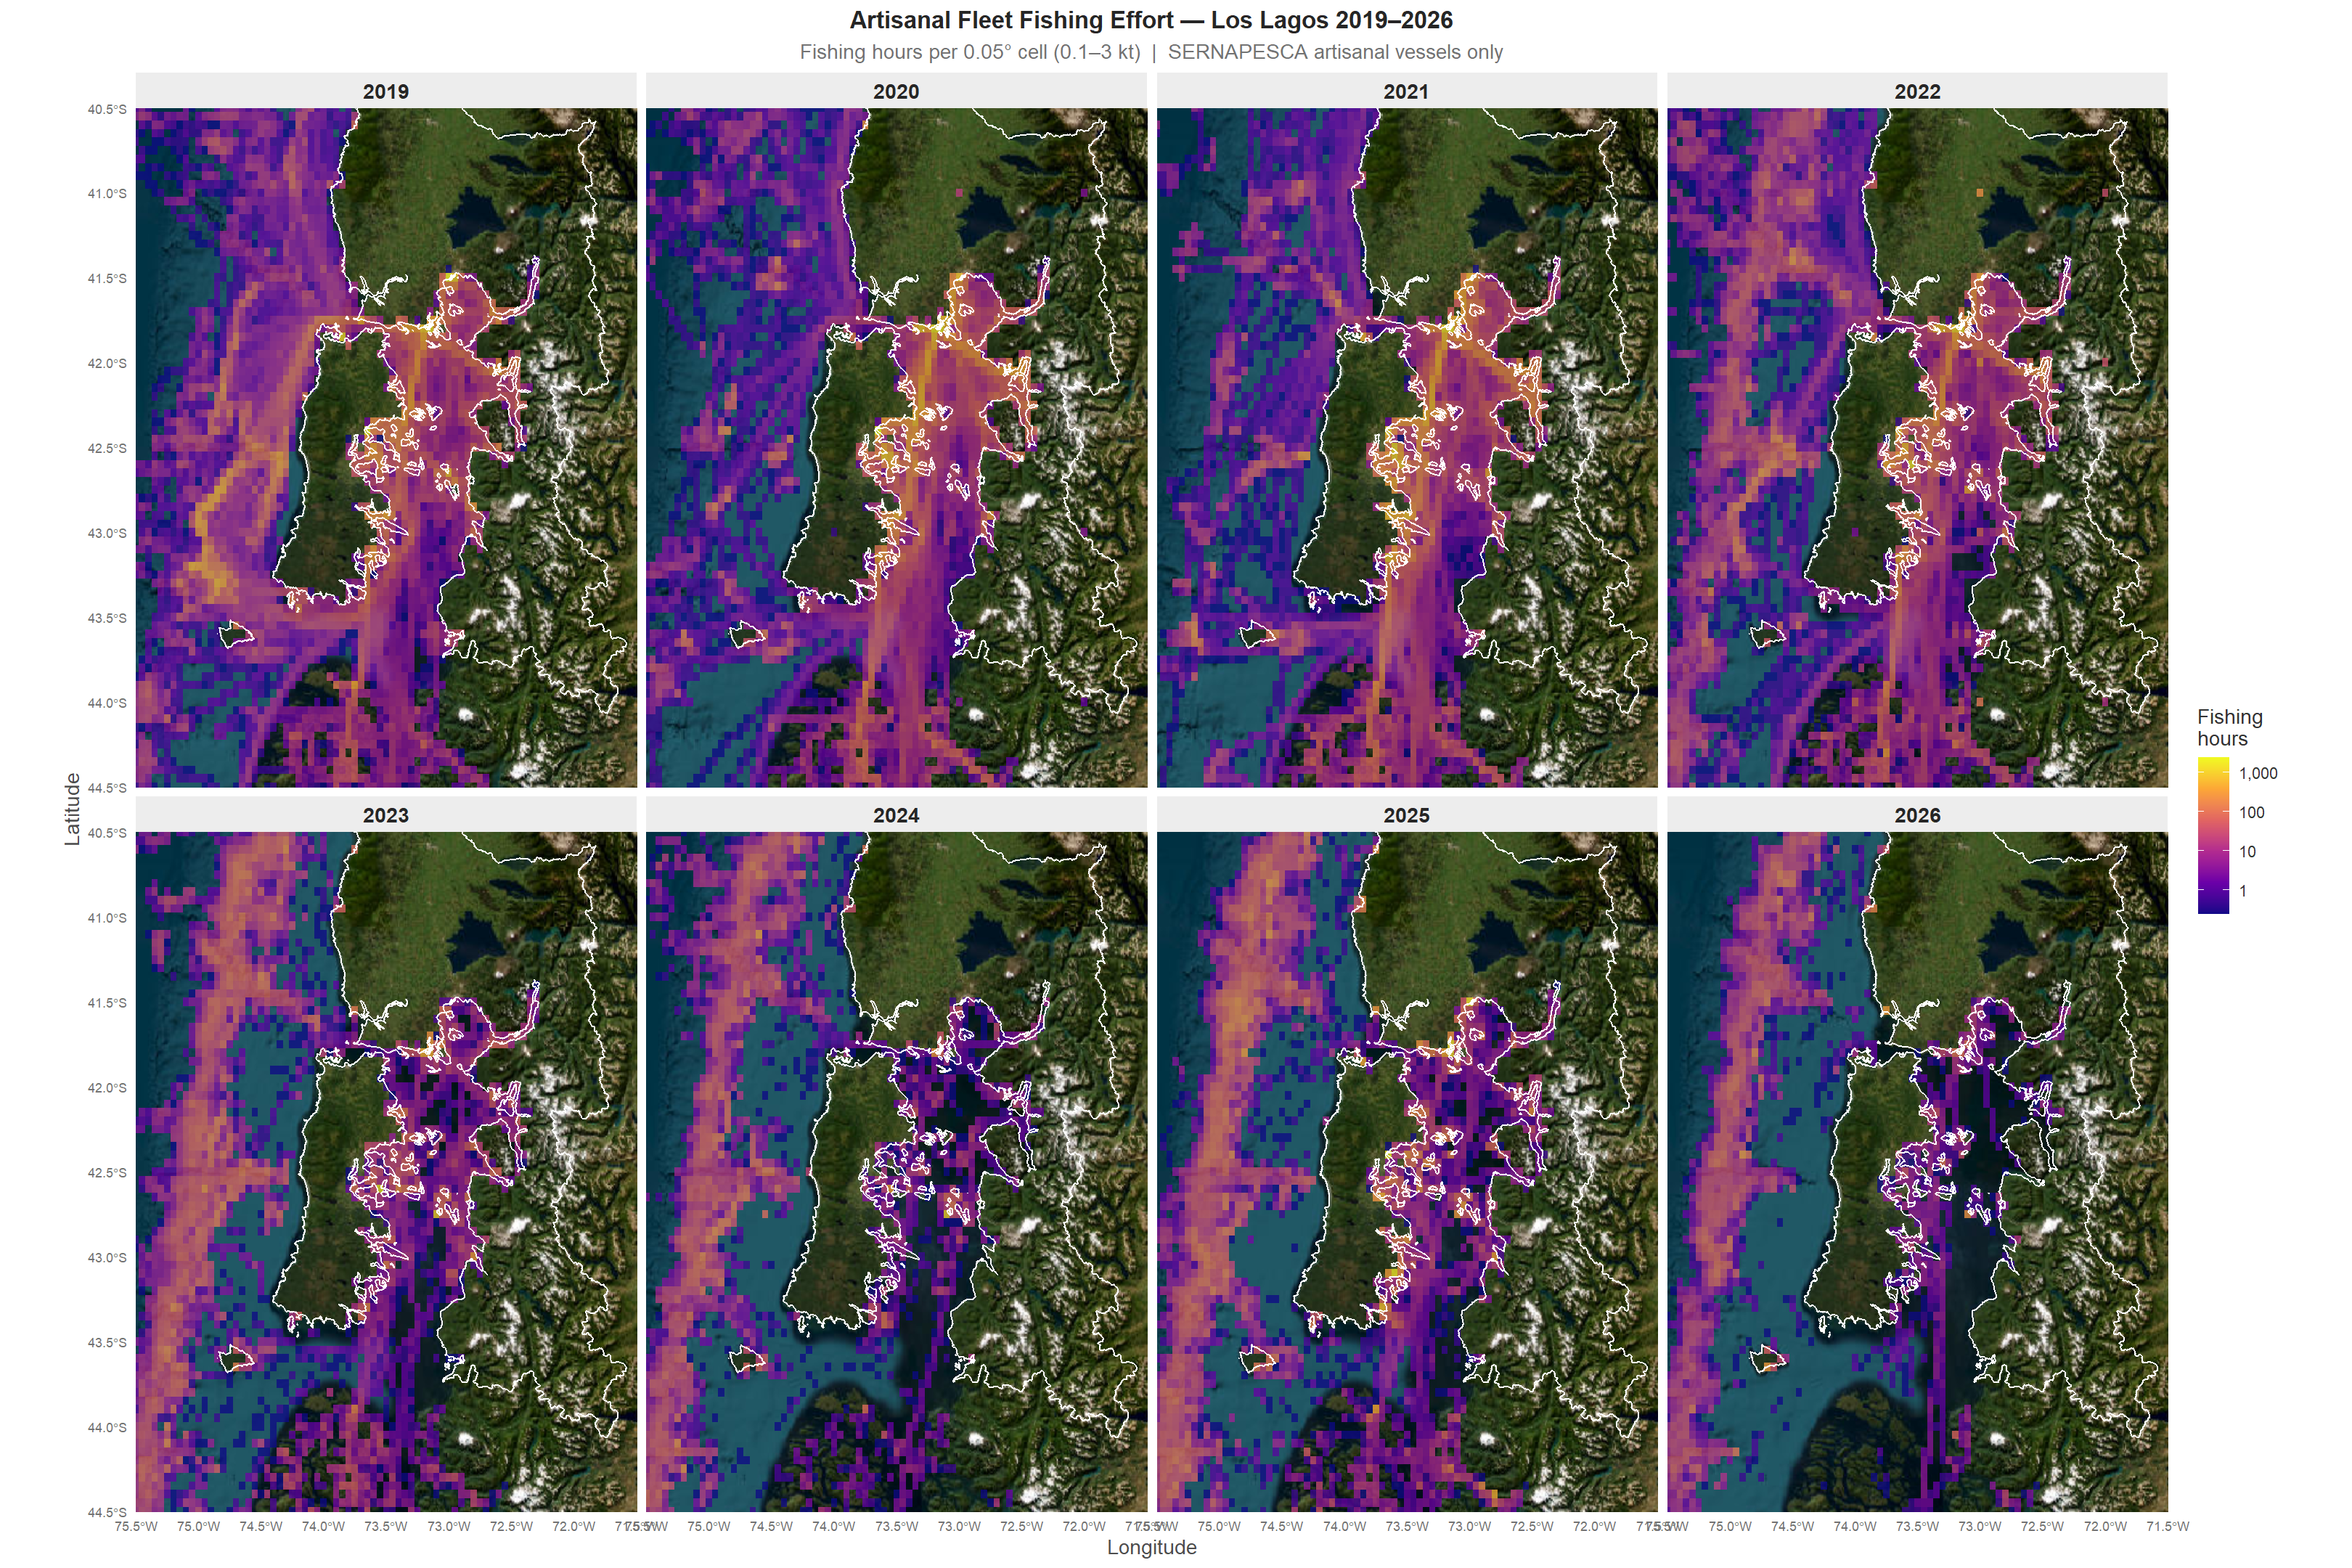
Fishing effort map
Spatial distribution of fishing effort (fishing hours per 0.05° grid cell) across Los Lagos 2019–2026.
Effort computation. Fishing effort is estimated using the speed-threshold method, a standard approach in VMS-based fisheries research (Gerritsen & Lordan, 2011; Behivoke et al., 2021). Each VMS ping is classified into one of three states based on recorded speed:
- Fishing: speed between 0.1 and 3.0 knots
- At anchor / moored: speed below 0.1 knots
- Steaming / transiting: speed above 3.0 knots
These thresholds are calibrated for small-scale artisanal vessels, which operate at substantially lower speeds than industrial trawlers (Behivoke et al., 2021). Fishing hours are then computed as the count of fishing-classified pings multiplied by 15 minutes — SERNAPESCA’s nominal reporting interval. The resulting effort is aggregated to a 0.05° spatial grid.
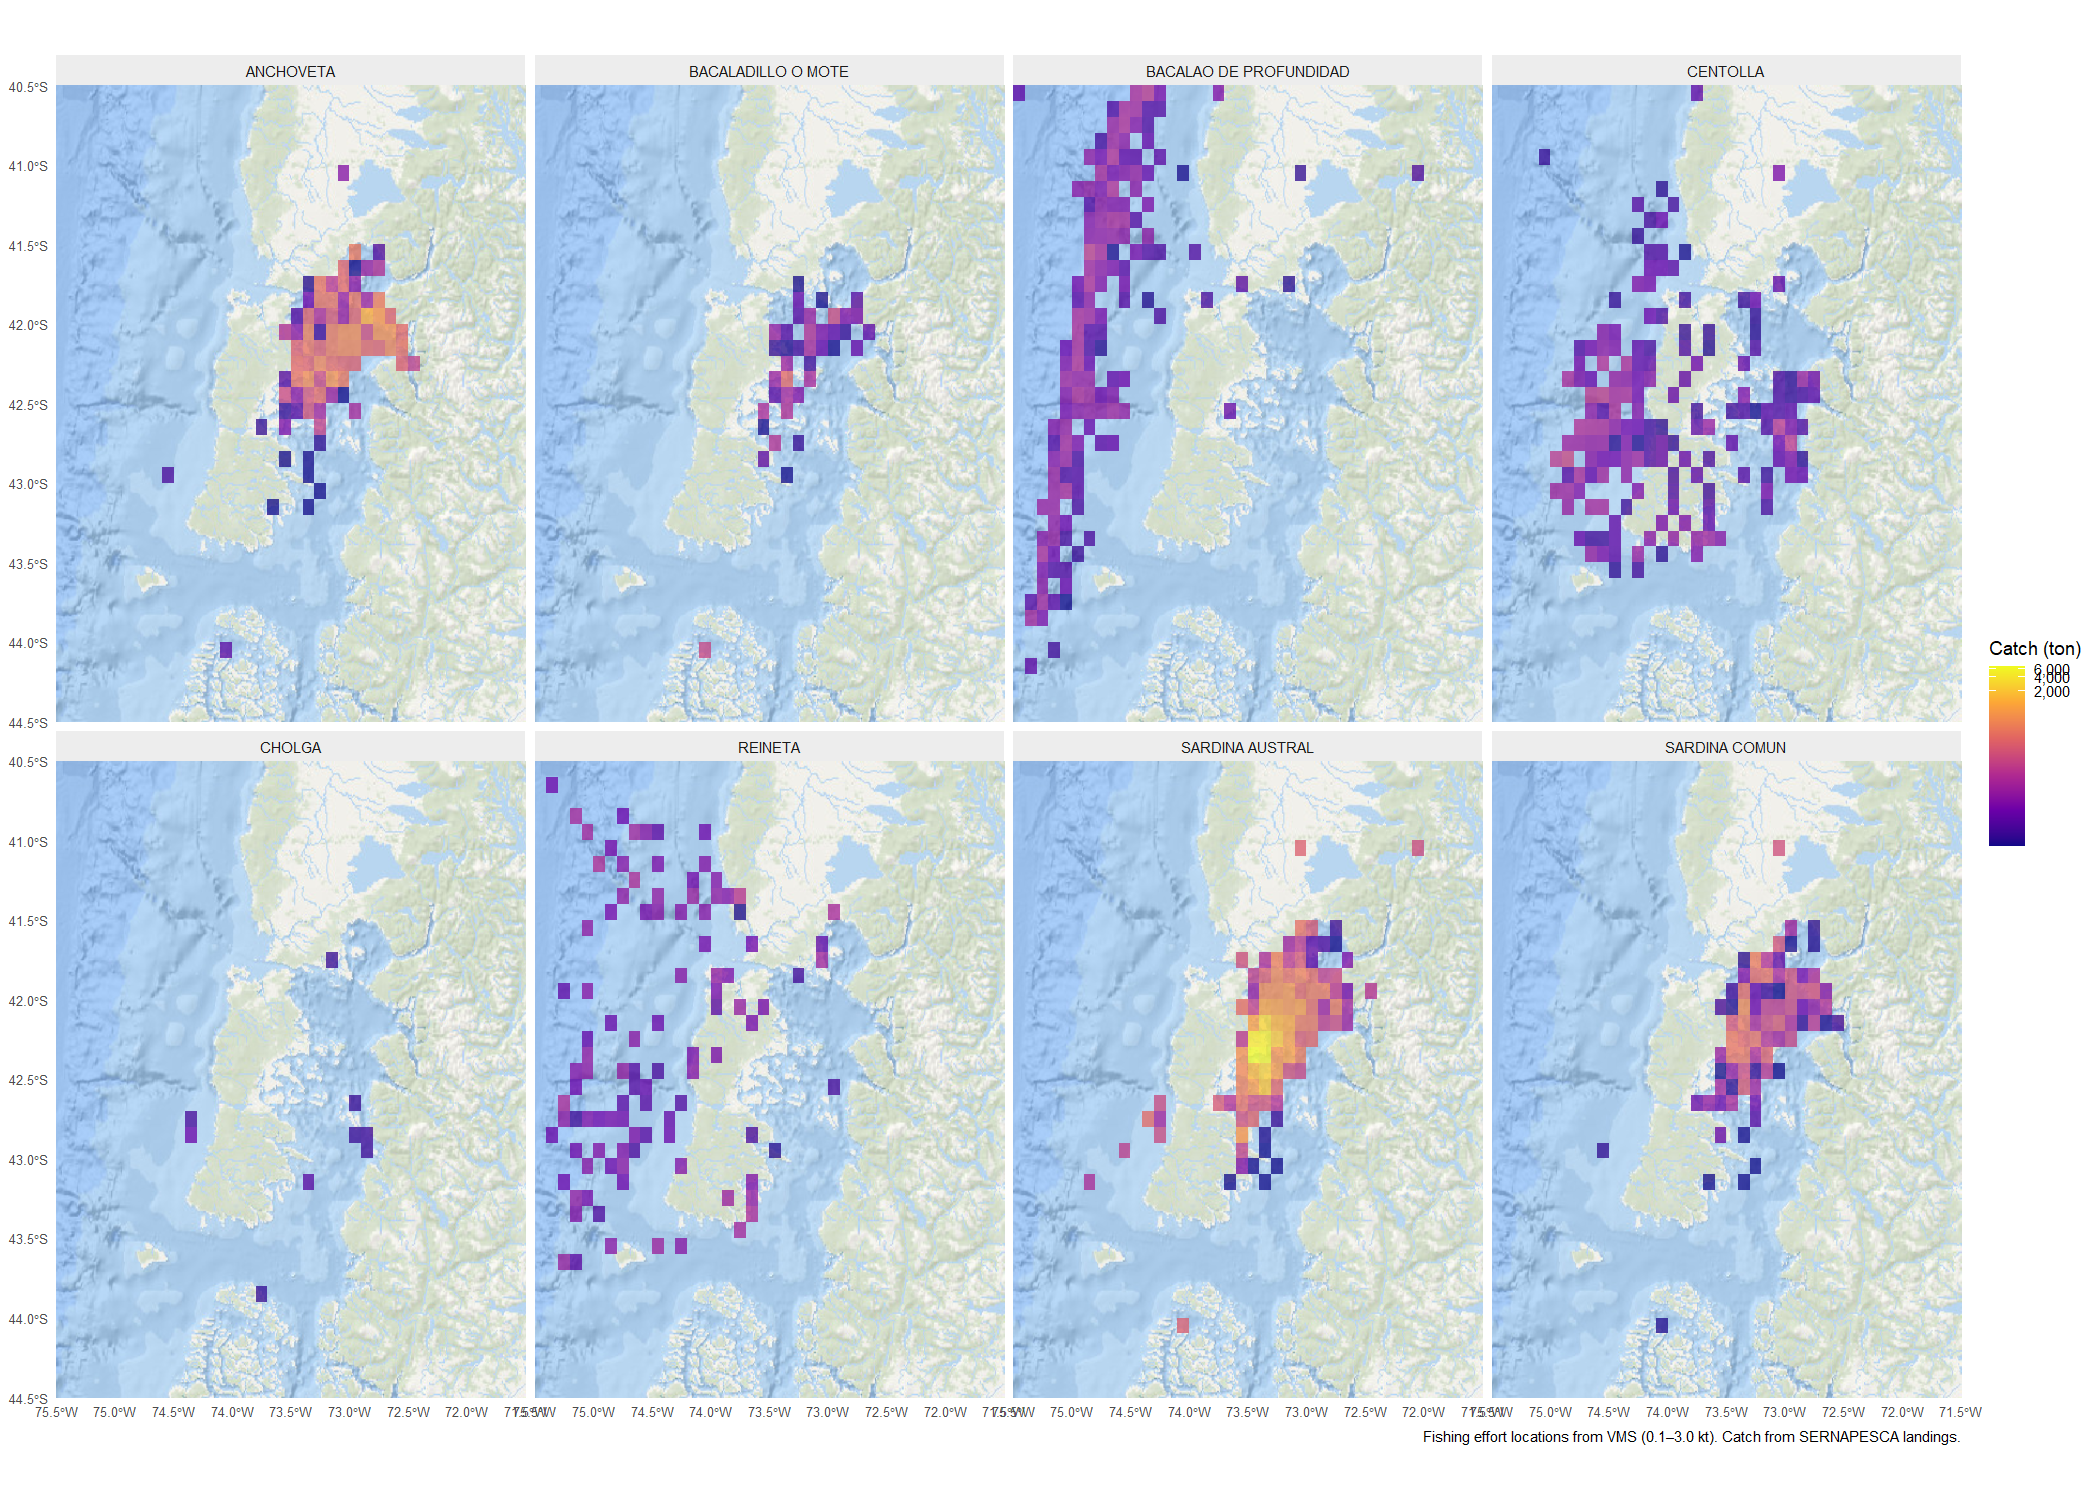
Species catch maps
Spatial distribution of landings by species, derived from SERNAPESCA’s production reports (Anuario Estadístico de Pesca y Acuicultura). Landing records were linked to VMS tracking data by matching vessel names — 193 out of 2,781 vessels in the production reports were matched to VMS-tracked artisanal vessels.
Grid map (0.1° cells, all years combined) — each cell shows total catch tonnage across all matched vessels:
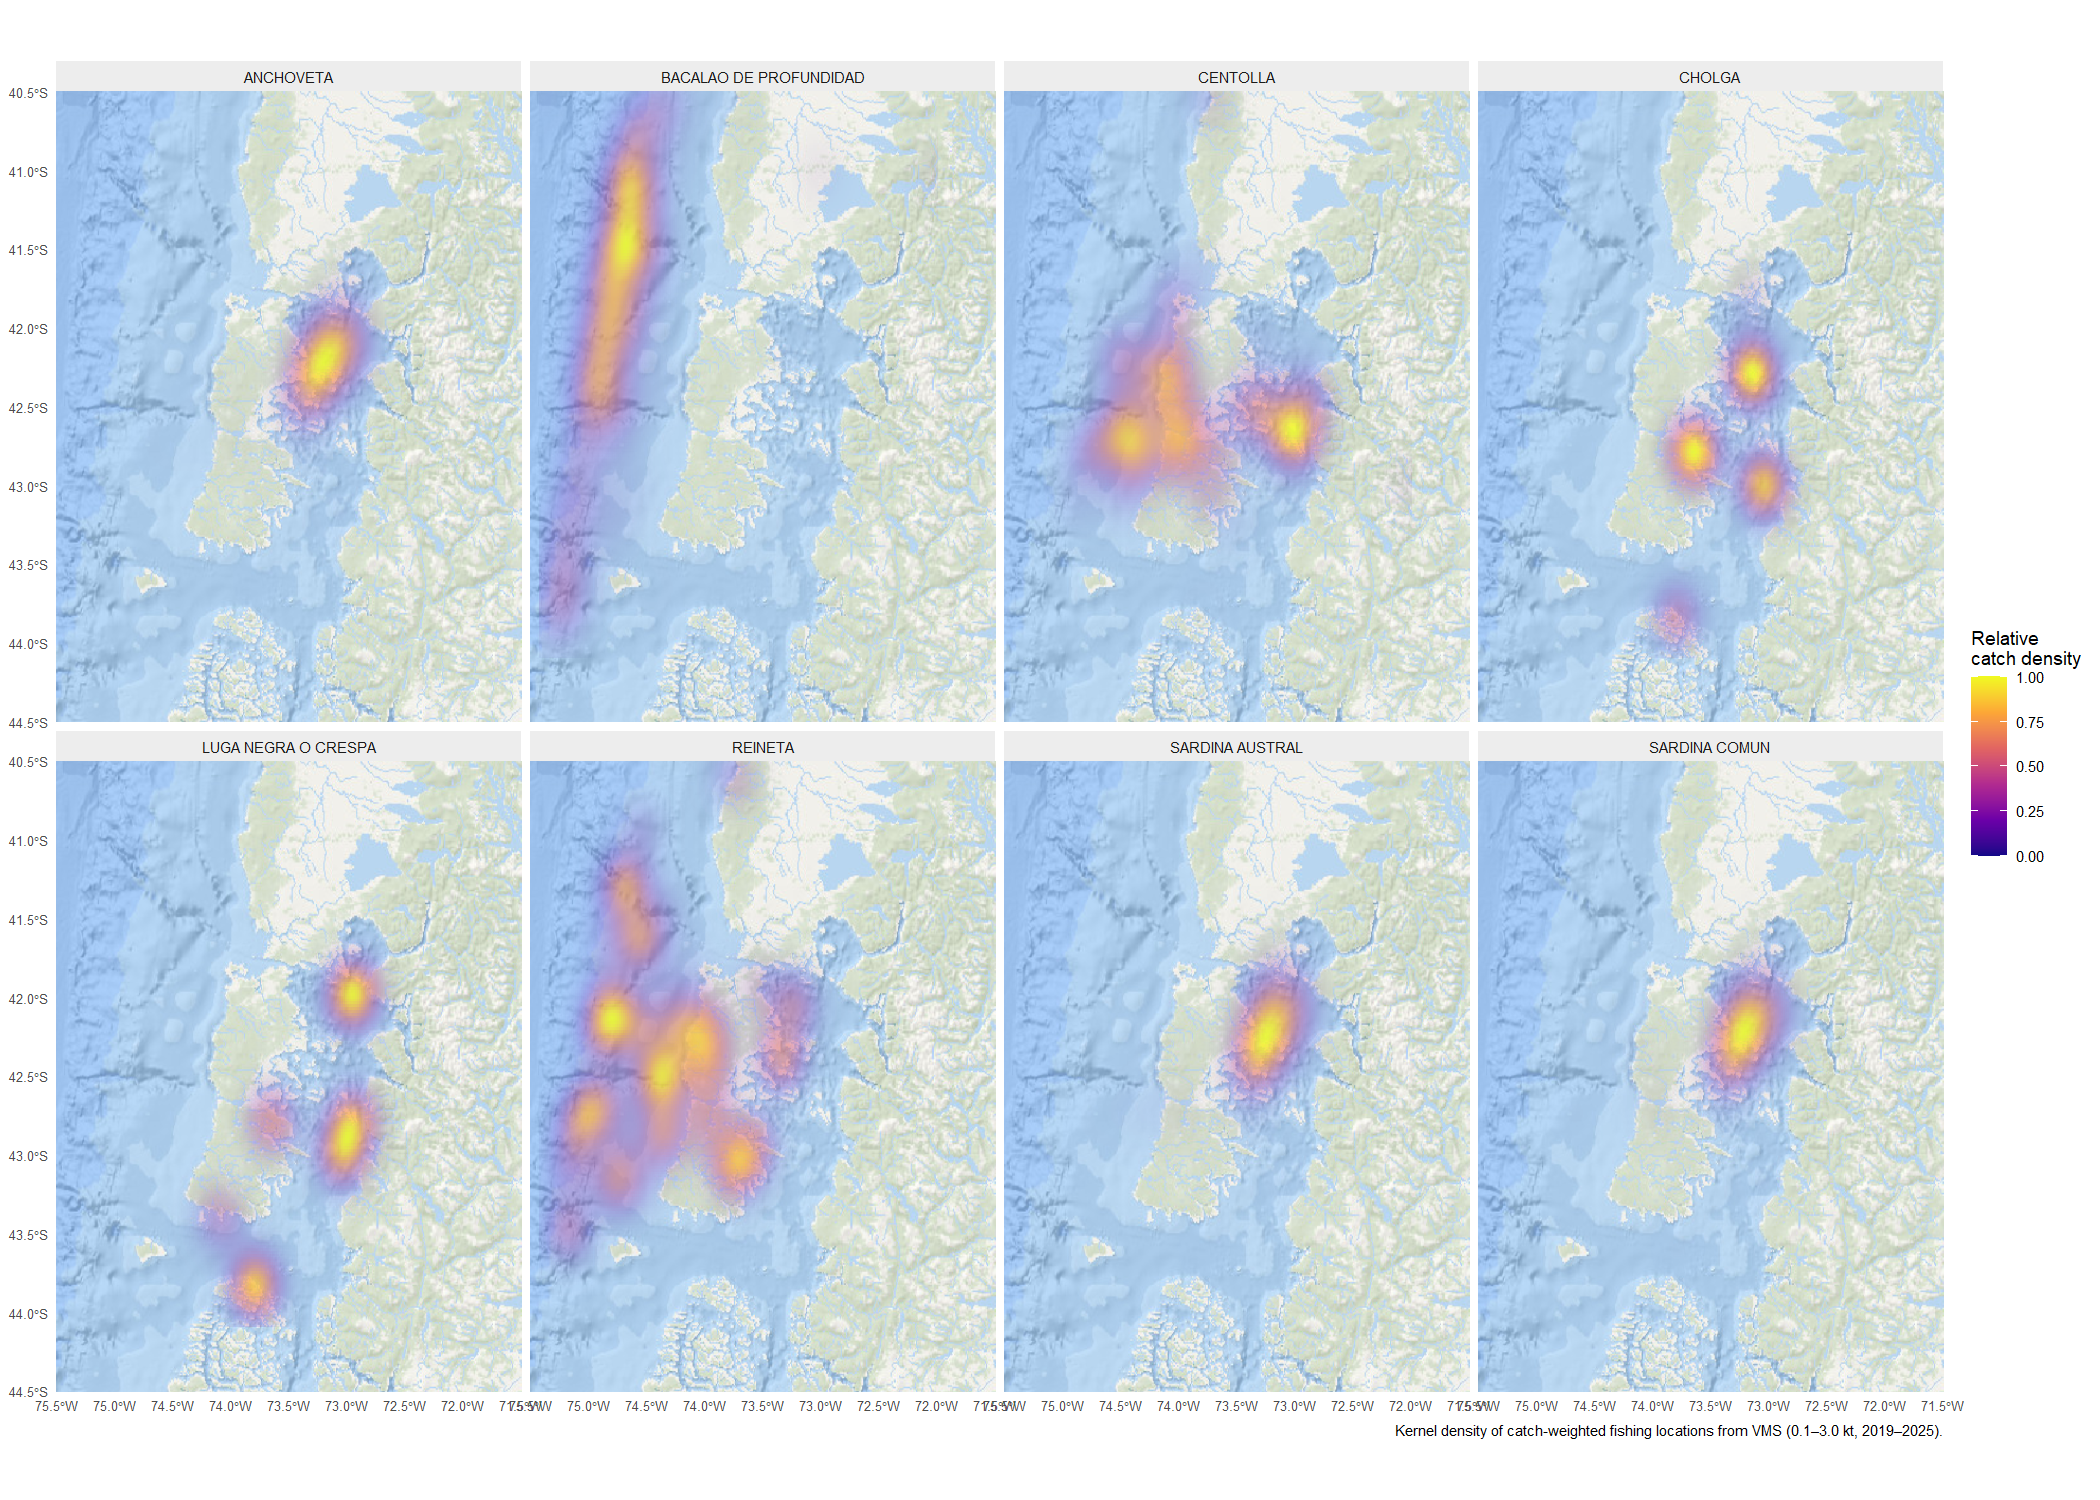
Kernel density map (all years combined) — fishing locations are smoothed using a two-dimensional Gaussian kernel to highlight core fishing areas for each species, independent of the arbitrary grid resolution. Sardina Austral and Anchoveta concentrate in the interior sea around Puerto Montt, while Reineta and Centolla show a broader distribution across the southern channels and open coast:
Technical details
| Language | R (100%) |
| Key packages | duckdb, rvest, ggplot2, sf, gganimate |
| License | MIT |
| Repository | github.com/robcareta/artesanal-fishing-behavior-Chile |
| Status | Active development |
References
Behivoke, F., Etienne, M.-P., Guitton, J., Randriatsara, R.M., Mahafina, J., & Léopold, M. (2021). Estimating fishing effort in small-scale fisheries using GPS tracking data and random forests. Ecological Indicators, 123, 107321. https://doi.org/10.1016/j.ecolind.2020.107321
Gerritsen, H., & Lordan, C. (2011). Integrating vessel monitoring systems (VMS) data with daily catch data from logbooks to explore the spatial distribution of catch and effort at high resolution. ICES Journal of Marine Science, 68(1), 245–252. https://doi.org/10.1093/icesjms/fsq137